

In a oncology clinic nestled within a bustling major metropolitan hospital, Dr. Lena Hart, a renowned pharmacologist with a specialization in oncology, leads a groundbreaking study. Her focus: to unravel the real-world effectiveness of the latest oncology drugs beyond the confines of controlled clinical trials. How will she do this? Dr. Hart’s team meticulously tracks a cohort of patients, each battling different forms of cancer, each different yet all united by a shared hope for a breakthrough in their treatment. AI is her colleague.
As part of her innovative approach, Dr. Hart employs a holistic assessment framework. She meticulously evaluates three specific yet equally important criteria; progression-free survival (PFS), overall survival (OS), and, crucially, quality of life (QoL) measures. This triad of metrics forms the cornerstone of her investigation, providing a multifaceted view of the drugs’ impact. Forging the way to a brand new day and brand new way. AI and the Predictive Analytics Framework provide insights that a decade ago were unimaginable.
Progression-free survival serves as a harbinger of each drugs’ efficacy, indicating the length of time patients live without their cancer worsening. Meanwhile, overall survival offers a stark, unvarnished measure of the drugs’ ultimate benefit — the extension of life. However, Dr. Hart posits that assessing the quality of the extended life is just as critical. This is a subjective measure. Through comprehensive QoL surveys, her team delves into the patients’ physical, emotional, and social well-being, painting a vivid picture of the drugs’ influence on their day-to-day existence. This is really what is all about: a better life.
The study’s findings, poised to revolutionize oncology treatment paradigms, underscore the complex interplay between survival metrics and quality of life. Dr. Hart’s work illuminates the nuanced ways in which these oncology drugs forge paths to not just longer, but more fulfilling lives for patients, offering a beacon of hope in the relentless fight against cancer.
Let’s review the data dictionary attributes, presented below.
| Attribute | Description | Type | Example |
|---|---|---|---|
| PatientID | Unique identifier for each patient. | String | P123456789 |
| Age | Age of the patient at the time of study enrollment. | Integer | 65 |
| Gender | Gender of the patient. | String | Female |
| CancerType | Type of cancer diagnosed. | String | Breast Cancer |
| TreatmentRegimen | Specific oncology drug(s) or treatment regimen prescribed. | String | Trastuzumab |
| StartOfTreatment | Date when the treatment started. | Date (YYYY-MM-DD) | 2023-01-15 |
| EndOfTreatment | Date when the treatment ended, if applicable. | Date (YYYY-MM-DD) | 2023-07-14 |
| ProgressionFreeSurvival | Time in months from start of treatment to disease progression or relapse. | Float | 12.5 |
| OverallSurvival | Time in months from start of treatment to death from any cause. | Float | 24.3 |
| QualityOfLifeScore | Composite score assessing patient’s quality of life, based on specific criteria. | Integer | 80 |
| AdverseEvents | Description of any adverse events experienced by the patient during the treatment. | String | Nausea, Fatigue |
| ResponseToTreatment | Categorization of the patient’s response to the treatment. | String | Complete Response |
| FollowUpPeriod | Time in months from end of treatment to last follow-up. | Float | 6.0 |
| SocioeconomicFactors | Relevant socioeconomic factors that could influence patient outcomes. | String | High income, College educated |
This following excerpt (FIGURE 2 DATA version 2.1) represents a anonymized cohort of 8 patients enrolled in a study assessing the real-world outcomes of oncology treatment regimens. Each entry in the dataset provides a comprehensive overview of individual patient profiles, including demographic information (age, gender), medical details (cancer type, treatment regimen), and outcomes related to the treatment (start and end dates, progression-free survival, overall survival, quality of life scores, adverse events, response to treatment, follow-up period, and socioeconomic factors).
Let’s delve deeper into the attributes. The PatientID serves as a unique identifier for each patient, ensuring privacy and confidentiality. The Age and Gender fields capture basic demographic information. CancerType specifies the form of cancer each patient is battling, while TreatmentRegimen details the specific oncology drugs or therapies administered. The StartOfTreatment and EndOfTreatment dates bookend the treatment period.
Crucial to understanding the efficacy and impact of the treatments are the ProgressionFreeSurvival and OverallSurvival metrics, measured in months, which track the duration patients live without disease progression and from the start of treatment to death, respectively. The QualityOfLifeScore quantifies the patients’ well-being during and after treatment on a scale, typically from 0 to 100, with higher scores indicating better quality of life.
AdverseEvents note any negative side effects experienced during the treatment, offering insights into the treatments’ tolerability. The ResponseToTreatment categorizes the effectiveness of the therapy, ranging from complete response to progressive disease. FollowUpPeriod measures the time in months from the end of treatment to the last follow-up, providing data on the treatment’s lasting effects. Lastly, SocioeconomicFactors acknowledge the role of social and economic conditions in patient outcomes, underscoring the multifaceted influences on health and treatment success.
This dataset is pivotal for evaluating the real-world impact of oncology treatments, offering a nuanced view of how drugs perform outside clinical trials in diverse patient populations. It emphasizes not just the clinical outcomes but also the quality of life and socioeconomic contexts, providing a holistic assessment of treatment efficacy and patient experiences.
| PatientID | Age | Gender | CancerType | TreatmentRegimen | StartOfTreatment | EndOfTreatment | ProgressionFreeSurvival | OverallSurvival | QualityOfLifeScore | AdverseEvents | ResponseToTreatment | FollowUpPeriod | SocioeconomicFactors |
|---|---|---|---|---|---|---|---|---|---|---|---|---|---|
| P49691325 | 69 | Female | Prostate Cancer | Bevacizumab | 2023-01-01 | 2023-06-04 | 16.9 | 14.9 | 77 | Hair Loss | Complete Response | 10.2 | High income |
| P47224486 | 32 | Female | Prostate Cancer | Pembrolizumab | 2023-01-08 | 2023-06-11 | 9.1 | 23.9 | 85 | None | Progressive Disease | 3.7 | Middle income |
| P53059726 | 78 | Male | Lung Cancer | Bevacizumab | 2023-01-15 | 2023-06-18 | 7.2 | 12.8 | 93 | Nausea | Partial Response | 11.9 | Low income |
| P46859911 | 38 | Male | Colorectal Cancer | Nivolumab | 2023-01-22 | 2023-06-25 | 23.1 | 33.8 | 69 | Fatigue | Complete Response | 10.0 | Middle income |
| P22813812 | 41 | Female | Colorectal Cancer | Bevacizumab | 2023-01-29 | 2023-07-02 | 23.4 | 18.2 | 95 | None | Progressive Disease | 4.8 | High income |
| P89102824 | 20 | Female | Colorectal Cancer | Nivolumab | 2023-02-05 | 2023-07-09 | 20.6 | 27.9 | 73 | Nausea | Progressive Disease | 3.0 | Low income |
| P47795587 | 39 | Male | Colorectal Cancer | Nivolumab | 2023-02-12 | 2023-07-16 | 11.5 | 19.5 | 90 | None | Progressive Disease | 10.3 | High income |
| P63568966 | 70 | Male | Prostate Cancer | Trastuzumab | 2023-02-19 | 2023-07 |
The following approach demonstrates how we used the used RRECKTEK’s Predictive Analytics Framework to empower Dr. Hart for informed decision-making. Understanding the most salient attribute in oncology treatment data, such as TreatmentRegiment effectiveness or ProgressionFreeSurvival rates, can significantly enhance decision-making. This drives treatment optimization.
The model type Random Forrest has several strengths. Take a look below at why a doctor might elect to use it as a method to drive decision making.
| Merit | Description |
|---|---|
| Accuracy | Highly accurate across various data types and tasks due to the ensemble of decision trees. |
| Handle Non-linearity | Capable of capturing non-linear relationships without needing explicit feature transformation. |
| Feature Importance | Provides insights into which features significantly influence the prediction outcome. |
| Robustness to Outliers and Noise | Less sensitive to outliers and noise, making the model robust and reliable. |
| Flexibility | Can be used for both classification and regression tasks, making it versatile. |
| Ease of Use | Generally requires less data preprocessing compared to other algorithms, handling categorical variables without one-hot encoding. |
| Parallelization | Training of individual trees can be easily parallelized for faster computation times. |
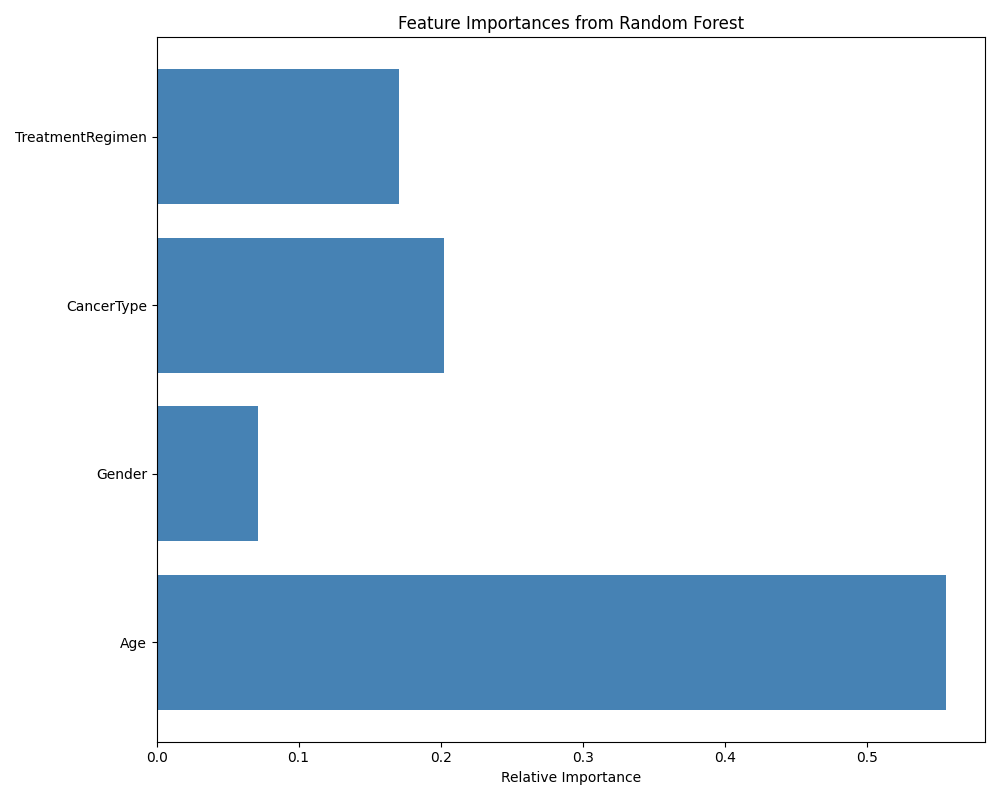
Dr. Hart explored oncology using machine learning and uncovered transformative insights. This Random Forest analysis of 25,000 synthetic oncology records pinpointed age as the key factor in treatment outcomes. This approach reveals age’s significant impact on therapeutic effectiveness and pushes the boundaries of customized oncology care. Dr. Hart aimed to uncover patterns and predictors within the complex landscape of cancer treatment outcomes. Her work made a compelling discovery: age stands out as the most crucial attribute affecting treatment efficacy and patient survival rates. Dr. Hart skillfully applied the Random Forest algorithm, showcasing the deep connection between patient age and treatment outcomes in oncology. She set a new standard for using advanced AI techniques to achieve personalized cancer care and enhance treatment strategies. Dr. Hart’s pioneering effort highlights machine learning’s power to redefine our approach to oncology, leading to better treatment plans tailored to individual patients and improved prognostic predictions.
| Aspect | Gradient Boosting Advantage |
|---|---|
| Performance on Complex Datasets | Provides superior predictive accuracy, especially in complex, heterogeneous data scenarios. |
| Handling of Outliers | More robust in handling outliers prevalent in medical datasets. |
| Predictive Power | Sequential corrective approach to minimize errors yields better performance on unbalanced datasets. |
| Flexibility in Loss Functions | Allows for the optimization of different loss functions, tailored to specific tasks. |
| Feature Importance | Provides insights into feature importance, crucial for understanding factors driving treatment. |
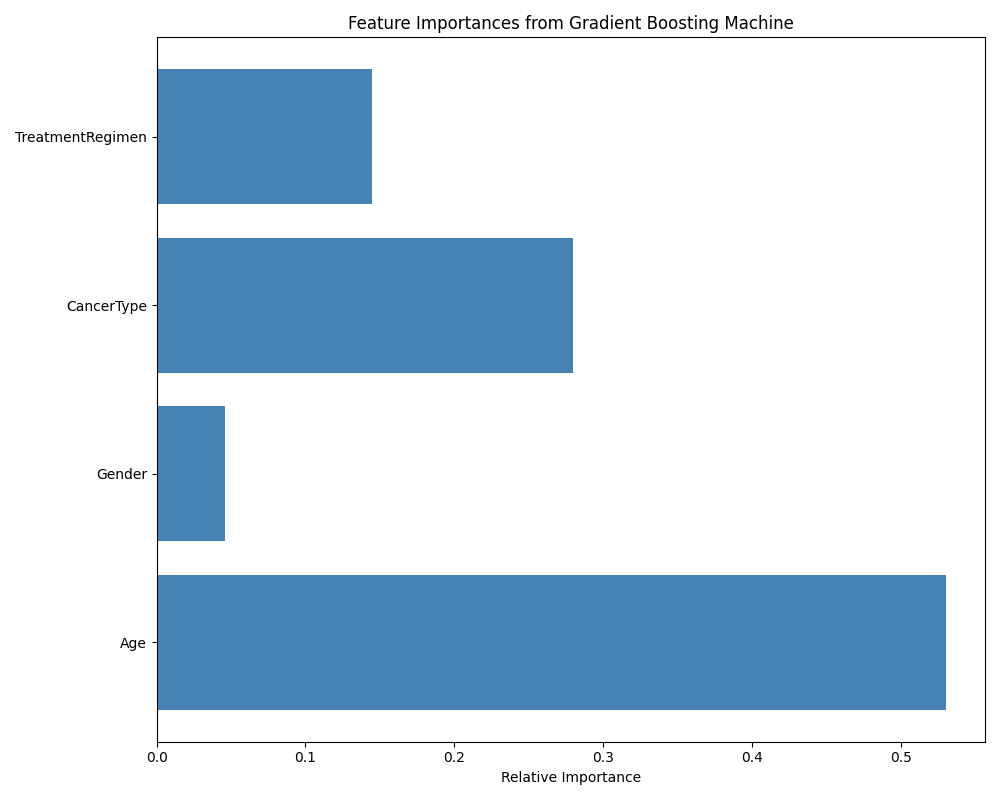
While Random Forest algorithms provide robust methods for making oncology treatment decisions through their ability to handle high-dimensional data and their ensemble approach, Dr. Hart’s transition to Gradient Boosting (GB) algorithms marked a strategic move to refine predictive capabilities in oncology further. GB algorithms, known for their sequential learning process aimed at minimizing errors from previous iterations, offer a nuanced and powerful approach for tackling the complex datasets typical in oncology. This methodological shift not only promises enhanced accuracy in predicting treatment outcomes and disease progression but also introduces a more adaptable framework capable of managing the unique challenges of medical data, such as outliers and unbalanced datasets.
In her follow-up effort, Dr. Hart utilized Gradient Boosting to build upon her initial findings from the Random Forest analysis, which identified age as a pivotal factor in treatment outcomes. By applying GB, she aimed to improve the predictive accuracy of her model, particularly focusing on the treatment efficacy for female patients. This advanced approach allowed her to uncover deeper insights into personalized care pathways, demonstrating the potential of Gradient Boosting to provide a more granular understanding of patient-specific factors influencing oncology treatments.
Dr. Hart’s innovative use of Gradient Boosting, following her successful application of Random Forest, underscores the complementary strengths of both algorithms in oncology research. While Random Forest laid the groundwork for identifying key predictive factors, Gradient Boosting enabled a refined analysis that pushed the boundaries of precision in treatment predictions and disease management. Together, these efforts highlight the transformative potential of machine learning in enhancing oncology treatment strategies and personalizing patient care, with a particular emphasis on gender-specific factors and treatment efficacy.
| Merit | Description |
|---|---|
| High Performance | GBMs often provide high accuracy and are effective for a wide range of problems, including both classification and regression tasks. |
| Handling of Non-linear Data | GBMs can capture complex non-linear relationships between features and the target variable without the need for data transformation. |
| Flexibility | Can handle various types of data (numerical, categorical) and work with missing data, making preprocessing simpler. |
| Feature Importance | Provides insights on which features are most influential in predicting the target variable, aiding in feature selection and model interpretability. |
| Robustness to Outliers | Due to the sequential nature of boosting, GBMs can be more robust to outliers compared to some other algorithms. |
| Regularization | GBM implementations like XGBoost, LightGBM, and CatBoost include options for regularization to prevent overfitting, enhancing the model’s generalization ability. |
| Scalability | Modern GBM frameworks are designed for efficiency and scalability, able to handle large datasets with millions of rows. |
| Continuous Improvement | The iterative nature of GBMs allows for continuous improvement in accuracy as more trees are added, up to a certain point before overfitting. |
In sharing her research findings, Dr. Hart uses straightforward visual aids to highlight key results from her work with Random Forest and Gradient Boosting models. These visuals effectively demonstrate how age emerged as a significant factor in determining treatment outcomes, a discovery made using the Random Forest model, and further insights into treatment effects on female patients, refined through Gradient Boosting.
The visualizations are designed to make complex data more accessible, illustrating the step-by-step improvements in predicting treatment outcomes and understanding patient-specific influences on treatment efficacy. Through clear and simple charts and graphs, Dr. Hart bridges the gap between advanced machine learning techniques and practical clinical applications, showcasing the potential of these models to inform more personalized and effective oncology care.
We validate our previous observation that the Age of the patient has the highest relative importance in helping Dr Hart make predictions. Synthetic patient records from Dr Hart’s analysis are available on the AWS Data Marketplace. The Predictive Analytics Framework is also available on the AWS Marketplace and directly from RRECKTEK LLC, Ronald P. Reck at rreck@rrecktek.com.